Certificate
Data Visualization in Tableau
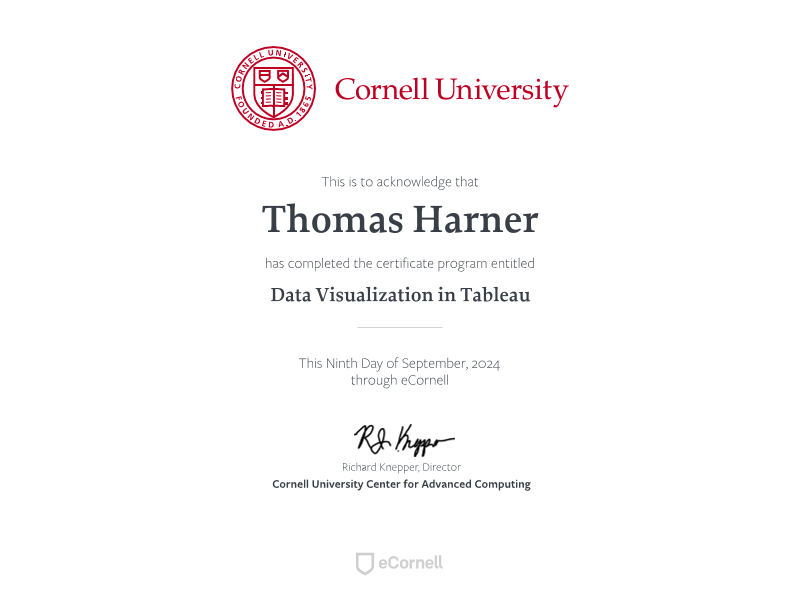
- Issued by
- eCornell (Cornell University)
- Expires
- Does not expire
A cohort-based professional certificate program with instructor-graded activities and applied projects.
Learning outcomes
- Create visualizations that transform raw data into actionable information that drives organizational change
- Improve data visualizations to ensure they resonate with the target audience
- Tell a compelling story with data to gain stakeholder buy-in and drive organizational change
Credit hours
- Professional Development Hours:
- Continuing Education Units:
- HR Certification Institute (HRCI) General:
- Society for Human Resource Management (SHRM):
- Project Management Institute (PMI):
Courses
- Creating Data Visualizations with Tableau
- Identify the different categories of visualizations
- Use Tableau to create comparison and composition charts
- Use Tableau to create distribution and relationship charts
- Explore other types of charts available with Tableau software
- Enhancing Data Visualizations with Tableau
- Plan and draft your visualization using Tableau
- Make your visualization clear
- Emphasize the important data
- Keep the audience in mind
- Iterate to improve your visualization
- Telling a Data-Driven Story with Tableau
- Implement Tableau software to tell a story with your data
- Plan a story
- Handle complicated content
- Improve your presentation
- Planning and Delivering Effective Presentations
- Analyze and define the purpose of a message
- Evaluate the intended audience and its needs
- Formulate the content of the message
- Embrace and rehearse the content
- Deliver the message with maximum effectiveness
- Study Anywhere.
- Become Anything.